Are you looking at improving the flows and efficiency within your workspace? Let’s use the Spaghetti diagram! It is a simple tool that you can bring to your teams to reach efficiency.
Spaghetti Diagrams can help your business understand the different kinds of flows that occur in your environment, identify areas of improvement, enhance operational excellence, and streamline your processes.
What is a Spaghetti Diagram?
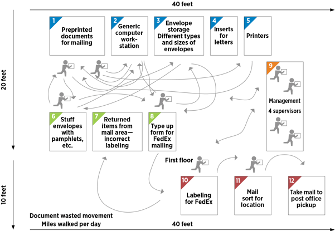
The Spaghetti Diagram is a visual representation of your workspace that shows all the flows that occur regarding a specific objective. For example, if you want to map all the flows of your materials in your warehouse, you will see inbound flows, put away flows, picking flows, shipping flows. If you were looking at understanding how your customers circulate within your space, you will see circulation flows and waiting areas. If you are mapping an assembly line, you would see raw material flows, inventory in progress, in progress flows, finished good flows.
The Anatomy and Steps of a Spaghetti Diagram
The Spaghetti Diagram begins with a layout of your workspace, be it a warehouse or an office setting. What we want is to see all the stations, work areas, and circulation paths where people or product would be moving through.
Then, identify a goal for the spaghetti diagram. Why are you documenting the flows? What are you trying to learn? What are you trying to improve? Everyone involved in this exercise needs to understand the goals and the information that is being looked at.
Afterward, provide the layout plan to all the participants. Create a colour legend, if applicable. For example, if you want to map the inbound, put away, picking, and shipping flows in your warehouse, assign each of these flows a separate colour on the map. Why separate colours? Because it helps us better understand the intersection between all these activities within the same layout.
Lastly, everyone to their layout and markers! This is where people start documenting all the flows that they perform during the set time for the exercise. Another way of performing this, especially when the person cannot stop and document the flows, is to assign observers to each flow. Each observer will then document the flows on their layout.
Benefits of Spaghetti Diagrams
Looking at a Spaghetti Diagrams can be confusing and dizzying. The sheer number of lines on the layout can become confusing and troublesome. But this is exactly why we use it! Through all these lines, it will be possible to see intersections, repetitions, congestion, confusion, back and forth, etc. Remember that these lines are representing real flows in your workspace. Imagine how your team members feel when there is a lot of activity happening and they keep intersecting, repeating, getting stuck in traffic because of the flows.
Once we have understood the flows and their impacts, the next step is to start looking at possible solutions for deconstructing the mess.
Spaghetti Diagram and Lean Principles
Spaghetti Diagrams are a great tool to identify the different forms of waste that are found in different organizations. These are delays, transport, motion, overproduction, over-processing, inventory, waiting, unused skills.
As per Lean principles, reducing the wastes, managing variability as well as reducing the overutilization of resources are the three key elements that lead to improving flow and customer satisfaction. See our article on the 3Ms of Lean.
Spaghetti Diagrams in Process Optimization
Spaghetti diagrams are one of the tools that is used in process optimization. They help to gain a better understanding of how our people and product move in the operations. This tool allows us to see the different kinds of flows, the challenges as well as identifying areas of improvement.
Conclusion
The Spaghetti Diagram, part of a larger set of tools, aims at understanding the current state of operations. In turn, it is possible to develop a future and improved state. It requires a clear and precise objective, dedicated team members to document, a layout plan, and coloured markers. It seems simple enough to perform if everyone understands the goal. Then, it’s a great tool to identify areas of improvement.
Are you ready to understand how your product moves and how your people are affected by the constant flow of goods? Then, unlock your operational potential and contact us!
____________________________________
About Veronica B. Marquez

I help growing manufacturing and service organizations scale without chaos—by turning operational challenges into sustainable performance gains. My superpower is making strategy real at every level of the business: connecting people, processes, and purpose to drive productivity, engagement, and resilience. I bring clarity to complexity and help teams execute better, faster, together. Through a proven lens of operational excellence, continuous improvement, and supply chain optimization, I work with leaders to align efforts, simplify execution, and create systems that actually support growth.
Named one of the Top 50 Experts in Operational Excellence by the PEX Network, I bring over 20 years of experience across sectors like manufacturing, distribution, mining, and public services. I teach Lean Six Sigma at the executive education level, lecture on service design in a master’s program, and host a LinkedIn Live series focused on Excellence in Industry 5.0. Ready to explore how operational excellence can transform your business? Reach out https://www.linkedin.com/in/veronicabm/.
Source:
https://asq.org/quality-resources/spaghetti-diagram
Photo by Anete Lusina: https://www.pexels.com/fr-fr/photo/plan-d-etage-accroche-sur-tableau-blanc-4792491/