Every quality system needs a way to make the invisible visible. Processes often live in binders, flowcharts, or someone’s head—yet when the time comes to scale operations or onboard new team members, the picture isn’t always clear. That’s where the Turtle Diagram comes in.
This simple visual brings clarity to complexity. By mapping what goes into a process, what comes out, who’s involved, and how performance is measured, it turns abstract procedures into a shared understanding.
Whether your organization is growing, preparing for an audit, or simply trying to improve consistency and accountability, the Turtle Diagram helps teams see the full picture—one step at a time.
What is a Turtle Diagram?
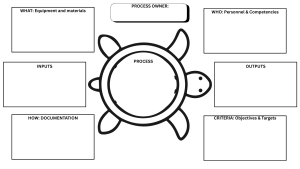
The Turtle Diagram is a practical visual tool used in quality management systems such as ISO 9001. It helps organizations understand each key process by breaking it down into seven components: inputs, outputs, activities, resources, people, methods, and performance indicators.
By arranging these elements in the shape of a turtle, teams can clearly see how their process works and how it connects to the larger system. It’s a cornerstone of process-based thinking—linking daily work to organizational objectives and customer value.
Why it matters
Whether your organization is scaling, improving cross-functional collaboration, or preparing for certification, the challenge isn’t only documentation—it’s alignment. Processes often exist, but the understanding of who does what, with which resources, and why, may vary across departments.
The Turtle Diagram brings everyone to the same page by visually answering four key questions:
- What do we need? (inputs and resources)
- What do we do? (core activities)
- Who does it and how? (people and methods)
- How do we know it works? (KPIs and results)
This simple visual helps organizations of any size ensure that each process is understood, measurable, and manageable. It creates shared visibility—reducing silos, supporting training, and clarifying accountability—so that every team member knows their role in delivering quality and performance.
A real-life story: Everyone owns their turtle
During a recent ISO 9001 readiness project, a manufacturing client needed to clarify its processes before the audit. Instead of adding more checklists, we introduced the Turtle Diagram.
Each department built its own turtle. As the teams mapped inputs, outputs, documents, and KPIs, something shifted. Process owners become engaged in better understanding their process, sharing it with their team members and starting conversations about how to make it better. They started to really own their process!
Every team became responsible for their turtle. That small change transformed engagement. By the end of the week, each group proudly presented its turtle to management. The audit preparation turned from a compliance exercise into a learning experience—and the organization gained a living, shared view of its quality system.
How to build your Turtle Diagram (step by step)
- Define the process – Choose one process at a time. Write it in the center (for example: order fulfillment).
- Identify inputs and suppliers – What resources, materials, or information are required?
- List key activities – Outline the essential steps that transform inputs into outputs.
- Determine outputs and customers – What is produced? Who receives it?
- Assign people and roles – Who is responsible or involved?
- Document methods and tools – Which procedures, standards, or systems guide the work?
- Define KPIs – How is performance measured? Use SMART indicators where possible.
Once complete, connect the sections visually to form the turtle shape. Review it with your team—this discussion often uncovers inconsistencies or improvement opportunities.
Tips to make it effective
- Keep it visual and collaborative—build it together on a whiteboard or digital canvas.
- Update it after process changes or improvement projects.
- Use it during onboarding and internal audits to explain processes.
- Link it to your risk analysis and continuous improvement plans to keep quality dynamic.
The big takeaway
The Turtle Diagram isn’t just about passing an audit. It’s a lens that helps teams understand, own, and continuously improve their processes. When everyone sees their part in the bigger system, quality stops being a department—it becomes a shared mindset.
At Aristeío, we help organizations turn process mapping and quality management into opportunities for engagement and performance. If your teams are growing, changing, or simply want to make process management more meaningful, contact us—we’ll help you make quality visible, together. Ready to Take Your Operations to the Next Level? Let’s discuss how our expertise can unlock your full potential. Contact us for a consultation tailored to your goals.
Additional reading:
ISO 9001:2015 Quality Management Systems – Requirements: https://www.iso.org/standard/62085.html
https://www.aristeio.com/en/blogue/continuous-improvement-manufacturing-productivity/
https://www.aristeio.com/en/blogue/fmea-for-business-continuity/
FAQ
What is the purpose of a Turtle Diagram?
It clarifies each process’s inputs, outputs, resources, and indicators, helping teams align their work with organizational objectives.
How does a Turtle Diagram support continuous improvement?
It provides visibility, making it easier to identify weak links, track KPIs, and engage teams in refining their processes.
Is the Turtle Diagram mandatory for ISO certification?
No. It’s a recommended tool, not a requirement. Auditors appreciate it because it demonstrates clear process understanding.
Can digital tools replace the Turtle Diagram?
Digital tools like Power BI or Impruver can complement it, but the collaborative mapping discussion remains the most valuable part.
About Veronica B. Marquez, MSc., CSSBB

I help growing manufacturing and service organizations scale without chaos—by turning operational challenges into sustainable performance gains. My superpower is making strategy real at every level of the business: connecting people, processes, and purpose to drive productivity, engagement, and resilience. I bring clarity to complexity and help teams execute better, faster, together. Through a proven lens of operational excellence, continuous improvement, and supply chain optimization, I work with leaders to align efforts, simplify execution, and create systems that actually support growth.
Named one of the Top 50 Experts in Operational Excellence by the PEX Network and ranked in the Favikon Top 200 Global Creators in Risk & Resilience (#13 worldwide, #3 in Canada), I bring over 20 years of experience across sectors like manufacturing, distribution, mining, and public services. I teach Lean Six Sigma at the executive education level, lecture on service design in a master’s program, and host a LinkedIn Live series focused on Excellence in Industry 5.0. Ready to explore how operational excellence can transform your business? Reach out https://www.linkedin.com/in/veronicabm/.
📷 Canva